

The graph in Figure P22.66 shows the current through a (1.0 Omega) resistor as a function of
Question:
The graph in Figure P22.66 shows the current through a \(1.0 \Omega\) resistor as a function of time.
a. How much charge flowed \(I(\mathrm{~A})\)
through the resistor during the \(10 \mathrm{~s}\) interval shown?
b. What was the total energy dissipated by the resistor during this time?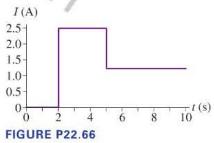
Fantastic news! We've Found the answer you've been seeking!
Step by Step Answer:
a To find the total charge that flowed through the resistor during the given interval we need to cal...View the full answer

Answered By
Saranya Pavithran
As a mechanical graduate having more than 90% in the academics and strong project knowledge using AutoCAD and SolidWorks software's for the designs. As a tutor having more than 1 year experience in subject matter expert.
0 Reviews
10+ Question Solved
Related Book For 

College Physics A Strategic Approach
ISBN: 9780321907240
3rd Edition
Authors: Randall D. Knight, Brian Jones, Stuart Field
Question Posted:
