

Which of the curves sketched in Figure P21.87 best approximates the shape of an equipotential drawn halfway
Question:
Which of the curves sketched in Figure P21.87 best approximates the shape of an equipotential drawn halfway between the charge center and the ground?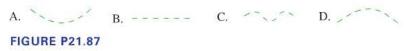
Storm clouds build up large negative charges, as described in the chapter. The charges dwell in charge centers, regions of concentrated charge. Suppose a cloud has \(-25 \mathrm{C}\) in a \(1.0-\mathrm{km}\)-diameter spherical charge center located \(10 \mathrm{~km}\) above the ground, as sketched in Figure P21.86. The negative charge center attracts a similar amount of positive charge that is spread on the ground below the cloud. The charge center and the ground function as a charged capacitor, with a potential difference of approximately \(4 \times 10^{8} \mathrm{~V}\). The large electric field between these two "electrodes" may ionize the air, leading to a conducting path between the cloud and the ground. Charges will flow along this conducting path, causing a discharge of the capacitor-a lightning strike.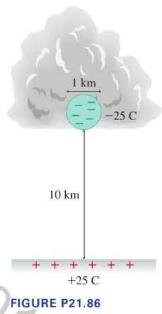
Step by Step Answer:


College Physics A Strategic Approach
ISBN: 9780321907240
3rd Edition
Authors: Randall D. Knight, Brian Jones, Stuart Field
