

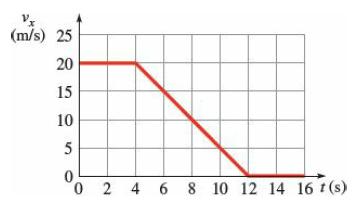
Speedometer readings are obtained and graphed as a car skids to a stop along a straight-line path.
Question:
Speedometer readings are obtained and graphed as a car skids to a stop along a straight-line path. How far does the car move between t = 0 and t = 16 s? Sketch a motion diagram showing the position of the car at 2 s intervals and sketch a graph of x(t).
Step by Step Answer:

This question has not been answered yet.
You can Ask your question!
Related Book For 

College Physics With An Integrated Approach To Forces And Kinematics
ISBN: 978-1260547719
5th Edition
Authors: Alan Giambattista
Question Posted:
