

The diagram shows the positions of a ball as it rolled down a track. The ball took
Question:
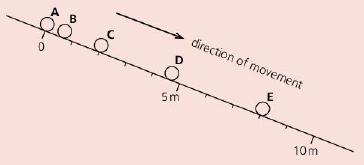
The diagram shows the positions of a ball as it rolled down a track. The ball took 0.5 s to roll from one position to the next. For example, it rolled from A to B in 0.5 s and from B to C in 0.5 s and so on.
a. Write down:
i. The distance travelled by the ball from A to E;
ii. The time taken by the ball to reach E.
b. Calculate the average speed of the ball in rolling from A to E. Write down the formula that you use and show your working.
c. Explain:
i. How you can tell from the diagram that the ball is speeding up;
ii. Why the ball speeds up.
Fantastic news! We've Found the answer you've been seeking!
Step by Step Answer:
a Write down i The distance travelled by the ball from A to E is 8 m ii The time taken ...View the full answer

Answered By
Ankit Saroha
I got my bachelor's degree from the University of Delhi. I also topped my college in my BSc course. Then I did my B Ed, Bachelor in Education, and then I did my Masters in physics and topped university. currently doing P.hD
0 Reviews
10+ Question Solved
Related Book For 
Question Posted:
