

The diagram shows a sketch of the curve f(x), which passes through the points A(0, 3) and
Question:
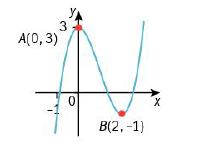
The diagram shows a sketch of the curve f(x), which passes through the points A(0, 3) and B(2, −1).
Sketch the graphs of
a) y = −f(x)
b) y = f(−x)
c) y = −f(x + 4)
d) y = 3−f(−x).
In each case, mark the new position of the points A and B,
writing down their coordinates.
Fantastic news! We've Found the answer you've been seeking!
Step by Step Answer:
Based on the given data and the graph we can answer the questions as below ...View the full answer

Answered By
Nazrin Ziad
I am a post graduate in Zoology with specialization in Entomology.I also have a Bachelor degree in Education.I posess more than 10 years of teaching as well as tutoring experience.I have done a project on histopathological analysis on alcohol treated liver of Albino Mice.
I can deal with every field under Biology from basic to advanced level.I can also guide you for your project works related to biological subjects other than tutoring.You can also seek my help for cracking competitive exams with biology as one of the subjects.
2+ Reviews
10+ Question Solved
Related Book For 

Complete Pure Mathematics 1 For Cambridge International AS & A Level
ISBN: 9780198427438
2nd Edition
Authors: Jean Linsky, Brian Western, James Nicholson
Question Posted:
