

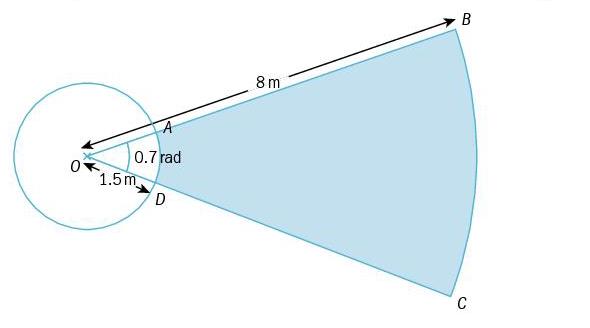
The diagram shows the area used for a sports event. The area is made from the sectors
Question:
The diagram shows the area used for a sports event. The area is made from the sectors of two circles, centre O. Calculate the area of the shaded region.
Fantastic news! We've Found the answer you've been seeking!
Step by Step Answer:
ANSWER To calculate the area of the shaded region we need to find the area of two sectors and subtra...View the full answer

Answered By
Churchil Mino
I have been a tutor for 2 years and have experience working with students of all ages and abilities. I am comfortable working with students one-on-one or in small groups, and am able to adapt my teaching style to meet the needs of each individual. I am patient and supportive, and my goal is to help my students succeed.
I have a strong background in math and science, and have tutored students in these subjects at all levels, from elementary school to college. I have also helped students prepare for standardized tests such as the SAT and ACT. In addition to academic tutoring, I have also worked as a swim coach and a camp counselor, and have experience working with children with special needs.
0 Reviews
10+ Question Solved
Related Book For 
Complete Pure Mathematics 1 For Cambridge International AS & A Level
ISBN: 9780198427438
2nd Edition
Authors: Jean Linsky, Brian Western, James Nicholson
Question Posted:
