

The graph shows a sketch of f(x). On separate diagrams, sketch the graphs of a) y =
Question:
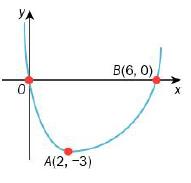
The graph shows a sketch of f(x). On separate diagrams, sketch the graphs of
a) y = f(x − 2)
b) y = −f(x)
c) y = f(2x)
d) y = −f(−x)
e) y = 3 + f(1 − x).
Mark the new position of the points O, A and B on each transformation, stating their coordinates.
Fantastic news! We've Found the answer you've been seeking!
Step by Step Answer:
Here we will describe the transformations and provide the new positions of the points O A and B for ...View the full answer

Answered By
Churchil Mino
I have been a tutor for 2 years and have experience working with students of all ages and abilities. I am comfortable working with students one-on-one or in small groups, and am able to adapt my teaching style to meet the needs of each individual. I am patient and supportive, and my goal is to help my students succeed.
I have a strong background in math and science, and have tutored students in these subjects at all levels, from elementary school to college. I have also helped students prepare for standardized tests such as the SAT and ACT. In addition to academic tutoring, I have also worked as a swim coach and a camp counselor, and have experience working with children with special needs.
0 Reviews
10+ Question Solved
Related Book For 

Complete Pure Mathematics 1 For Cambridge International AS & A Level
ISBN: 9780198427438
2nd Edition
Authors: Jean Linsky, Brian Western, James Nicholson
Question Posted:
