

The timing diagram in Figure P6.7 illustrates a system in which ope rations occur as three consecutive
Question:
The timing diagram in Figure P6.7 illustrates a system in which ope rations occur as three consecutive clock cycles. Actions taking place in clock cycle 1 are scalable; that is, if the clock cycle time changes, the actions can be speeded up or slowed down correspondingly. In cycle 2, the action process 1 requires 25 ns and in clock cycle 3 the action process 2 requires 32 ns. If the clock cycle is less than the time required for process 1 or process 2, then one or more wait cycles have to be inserted for the process to complete.
What is the time to complete an operation if the clock cycle time is
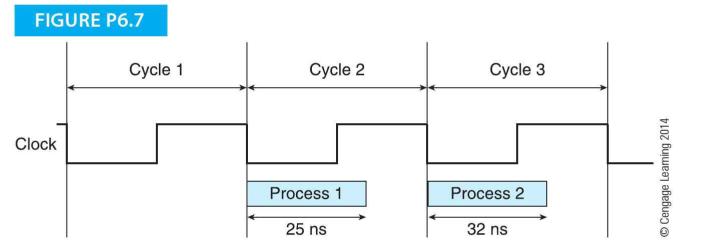
a. 50 ns
b. 40 ns
c. 30 ns
d. 20 ns
e. 10 ns
Fantastic news! We've Found the answer you've been seeking!
Step by Step Answer:
a 50 ns b 40 ns C 30 ns d 20 ns e 10 ns If the cycle time is 50 ns ...View the full answer

Answered By
Muhammad Ahtsham Shabbir
I am a professional freelance writer with more than 7 years’ experience in academic writing. I have a Bachelor`s Degree in Commerce and Master's Degree in Computer Science. I can provide my services in various subjects.
I have professional excellent skills in Microsoft ® Office packages such as Microsoft ® Word, Microsoft ® Excel, and Microsoft ® PowerPoint. Moreover, I have excellent research skills and outstanding analytical and critical thinking skills; a combination that I apply in every paper I handle.
I am conversant with the various citation styles, among them; APA, MLA, Chicago, Havard, and AMA. I also strive to deliver the best to my clients and in a timely manner.My work is always 100% original. I honestly understand the concern of plagiarism and its consequences. As such, I ensure that I check the assignment for any plagiarism before submission.
392+ Reviews
587+ Question Solved
Related Book For 
Computer Organization And Architecture Themes And Variations
ISBN: 9781111987046
1st Edition
Authors: Alan Clements
Question Posted:
