

Consider the TCP trace in Figure 6.29. Identify time intervals representing slow start on startup, slow start
Question:
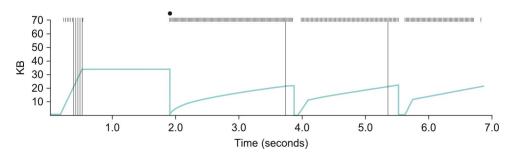
Consider the TCP trace in Figure 6.29. Identify time intervals representing slow start on startup, slow start after timeout, and linearincrease congestion avoidance. Explain what is going on from T =
0.5 to T = 1.9. The TCP version that generated this trace includes a feature absent from the TCP that generated Figure 6.11. What is this feature? This trace and the one in Figure 6.13 both lack a feature.
What is it?
Figure 6.29)
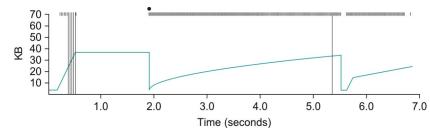
Figure 6.11)
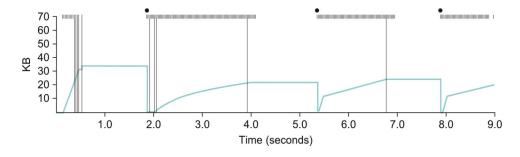
Figure 6.13)
Fantastic news! We've Found the answer you've been seeking!
Step by Step Answer:

Answered By
Elias Gichuru
am devoted to my work and dedicated in helping my clients accomplish their goals and objectives,providing the best for all tasks assigned to me as a freelancer,providing high quality work that yields high scores.promise to serve them earnestly and help them achieve their goals.i have the needed expertise,knowledge and experience to handle their tasks.
325+ Reviews
859+ Question Solved
Related Book For 

Computer Networks A Systems Approach
ISBN: 9780128182000
6th Edition
Authors: Larry L. Peterson, Bruce S. Davie
Question Posted:
