

The graph shows how the seafloor of the Atlantic Ocean varies with depth. Why was this picture
Question:
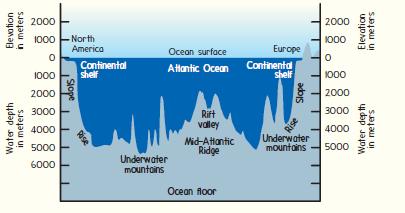
The graph shows how the seafloor of the Atlantic Ocean varies with depth. Why was this picture surprising to scientists before Harry Hess? How does this graph support the hypothesis of continental drift?
Step by Step Answer:

This question has not been answered yet.
You can Ask your question!
Related Book For 

Conceptual Integrated Science
ISBN: 9780321818508
2nd Edition
Authors: Paul G Hewitt, Suzanne A Lyons
Question Posted:
