

Examine the bar chart schedule with the activities and their durations as shown in the figure. The
Question:
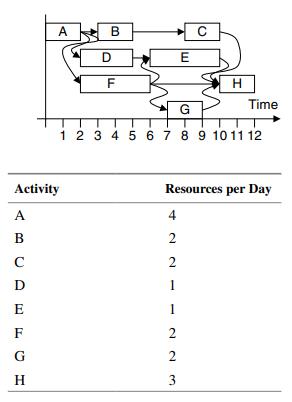
Examine the bar chart schedule with the activities and their durations as shown in the figure. The table shows how many resources an activity uses. Draw a histogram of resource use over time. Perform resource leveling on the schedule to reach an optimum and record your steps.
Step by Step Answer:

This question has not been answered yet.
You can Ask your question!
Related Book For 

Construction Management
ISBN: 9781119256809
5th Edition
Authors: Daniel W. Halpin, Bolivar A. Senior, Gunnar Lucko
Question Posted:
