

Table P2.5 on Page 54 summarizes the financial conditions for Intel Corporation (INTC), a manufacturer of various
Question:
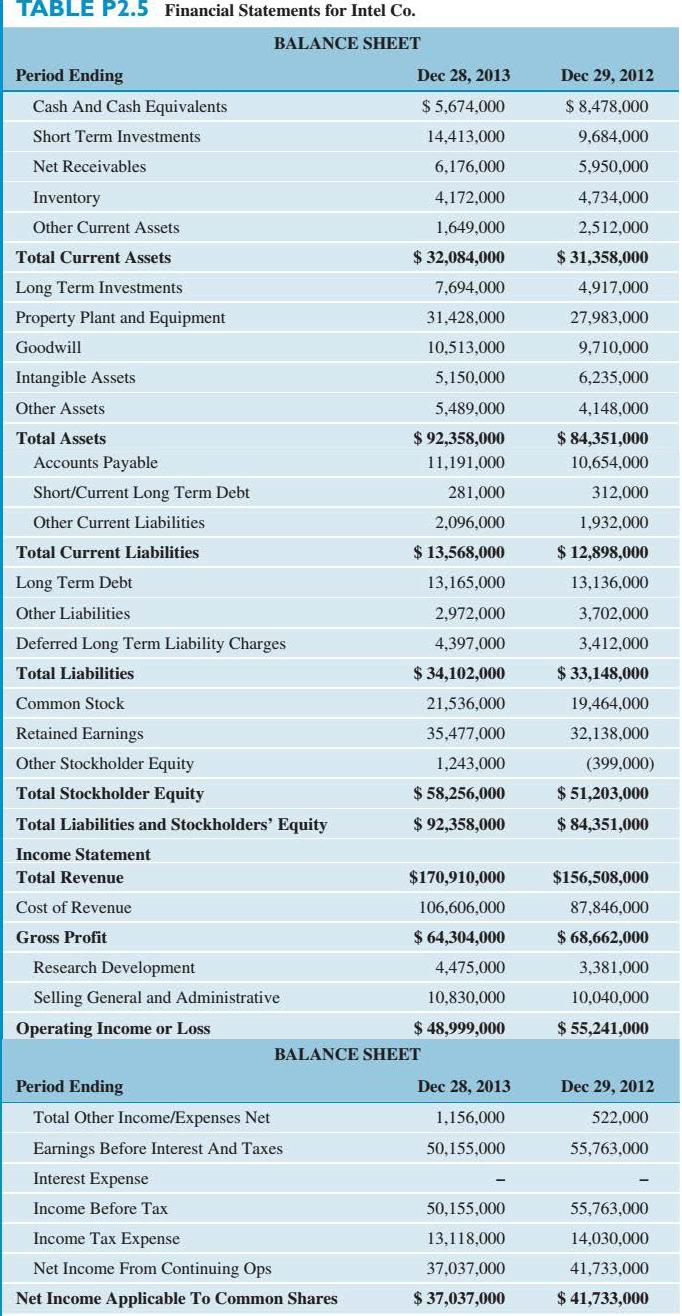
Table P2.5 on Page 54 summarizes the financial conditions for Intel Corporation (INTC), a manufacturer of various computer-processing chips for fiscal year 2013. Compute the various financial ratios and Interpret the firm’s financial health during fiscal year 20 13. The closing stock price was $25.50 on December 31, 2013 and the average number of outstanding shares was 4.98 billion.
(a) Debt ratio
(b) Times-interest-earned ratio
(c) Current ratio
(d) Quick (acid-test) ratio
(e) Inventory-turnover ratio
(f) Days-sales-outstanding
(g) Total-assets-turnover ratio
(h) Profit margin on sales
(I) Return on total assets (with a tax rate of 40%)
(j) Return on common equity
(k) Price/earnings ratio
(l) Book value per share
Fantastic news! We've Found the answer you've been seeking!
Step by Step Answer:
a Debt ratio 3410200092358000 3692 b Timeinterestearned ratio 501550000 NA c Current ratio 320840...View the full answer

Answered By
PALASH JHANWAR
I am a Chartered Accountant with AIR 45 in CA - IPCC. I am a Merit Holder ( B.Com ). The following is my educational details.
PLEASE ACCESS MY RESUME FROM THE FOLLOWING LINK: https://drive.google.com/file/d/1hYR1uch-ff6MRC_cDB07K6VqY9kQ3SFL/view?usp=sharing
3+ Reviews
10+ Question Solved
Related Book For 
Question Posted:
