

Employ a diagram similar to Figure 2.5 to show an individual?s leisure?income choices before and after a
Question:
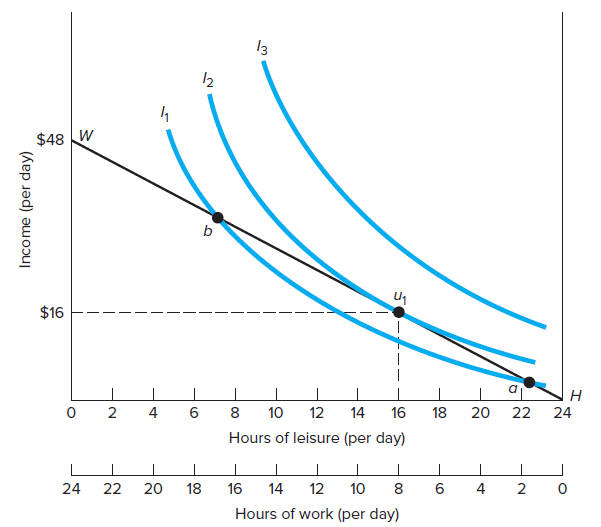
Employ a diagram similar to Figure 2.5 to show an individual?s leisure?income choices before and after a wage rate decrease. Isolate the income and substitution effects, indicate whether each increases or decreases hours of work, and use the two effects to explain the overall impact of the wage decline on hours of work. Is your worker on the forward-rising or backward-bending portion of the labor supply curve?
Fantastic news! We've Found the answer you've been seeking!
Step by Step Answer:
Ans The substitution effect of higher wages means workers will give up leisure to do more hours of w...View the full answer

Answered By
POOJA PANDEY
I AM POOJA PANDEY. I AM 30 YEAR OLD. MY HIGHEST QUALIFICATION IS MBA FROM SMU. I HAVE COMPLETED GRADUATION FROM DU. 5 YEARS TEACHING EXPERIENCE IN PUBLC SCHOOL.
0 Reviews
10+ Question Solved
Related Book For 
Contemporary Labor Economics
ISBN: 978-1259290602
11th Edition
Authors: Campbell R. McConnell, Stanley L. Brue, David Macpherson
Question Posted:
