

Assume the same information for Keebler-Olson as in Problems 11-31, 11-32, 11-33, and 11-34. James plans to
Question:
Assume the same information for Keebler-Olson as in Problems 11-31, 11-32, 11-33, and 11-34. James plans to invest $100 in each of the 1,000 loans he is examining. If he decides not to invest in a loan, he will invest the $100 in an alternative investment. As James and the data scientist work to improve their model, James mentions that different model predictions are associated with different payoffs for Keebler-Olson. Based on his management accounting experience, James estimates that the average payout for a repay loan of 3 years is $48 dollars. James also estimates that Keebler-Olson loses $60 over 3 years if it purchases a default loan. If Keebler-Olson does not invest in a loan, it places the money in an alternative investment with a payout of $14 over 3 years. James uses the pruned tree to evaluate the total payoff at a cutoff value of 0.25 and a cutoff value of 0.50.
Data from Problems 11-31:
James Silva is a management accountant at Keebler-Olson, where he is in charge of their investment portfolio. In 2015, James worked with a data scientist to develop a model that predicts how a given loan will perform in the future based on the characteristics of the borrower available on the peer-to-peer lending platform Mandel Credit. On April 1, 2016, he purchased $100,000 worth of loans with 36-month terms (3 years). His investments had performed well. James planned to invest another $100,000 on January 1, 2020. Looking ahead, he considers some strategic questions around the model.
Data from Problem 11-32:
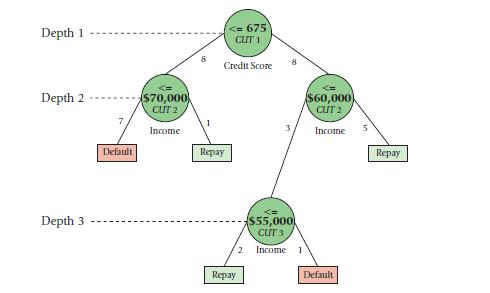
Assume the same information for Keebler-Olson as in Problem 11-31. James Silva and the data scientist on his team work together to develop the following decision tree:
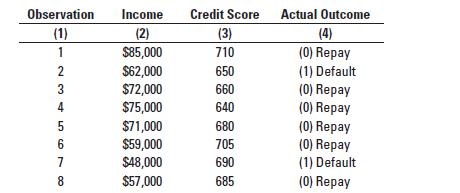
The data science team tests the model on the following validation set:
Data from Problem 11-34:
Assume the same information for Keebler-Olson as in Problems 11-31, 11-32, and 11-33. While James is presenting his work to the president and his team, someone asks whether he had calculated the overall likelihood value for the trees. Wanting to make sure that he had fully evaluated the model, James agrees that this is a good idea.
Required:
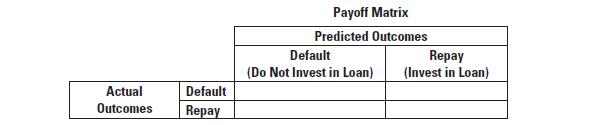
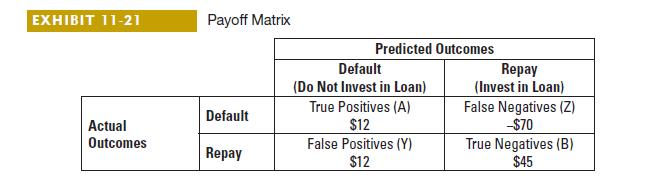
1. Fill in the payoff matrix below as in Exhibit 11-21.
Data from Exhibit 11-21:
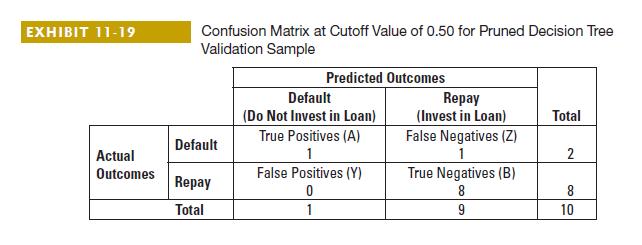
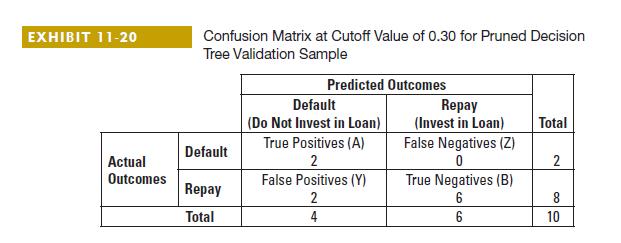
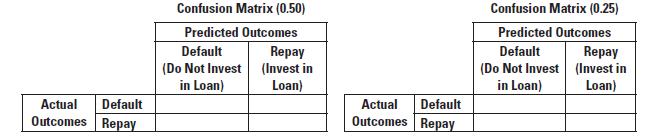
 2. James is deciding whether to use a cutoff of 0.25 or 0.5. Complete the confusion matrices below using the pruned tree for each cutoff as in Exhibits 11-19 and 11-20.
Data from Exhibits 11-19 and 11-20:
3. What cutoff value should James use? Explain.
Step by Step Answer:
Question 1 Question 2 Question 3 He should use C...View the full answer


Horngrens Cost Accounting A Managerial Emphasis
ISBN: 9781292363073
17th Global Edition
Authors: Srikant Datar, Madhav Rajan
