Consider the 2013 declined loan data from LendingClub titled RejectStatsB2013 from the Connect website. Similar to the
Question:
Consider the 2013 declined loan data from LendingClub titled “RejectStatsB2013” from the Connect website. Similar to the analysis done in the chapter, let’s scrub the risk score data. First, because our analysis requires risk scores, debt-to-income data, and employment length, we need to make sure each of them has valid data.
Open the file in Excel.
Sort the file based on risk score and remove those observations (the complete row or record) that have a missing score or a score of zero.
Assign each risk score to a risk score bucket similar to the chapter. That is, classify the sample according to this breakdown into excellent, very good, good, fair, poor, and very bad credit according to their credit score noted in Exhibit 1-10. Classify those with a score greater than 850 as “Excellent”. Consider using if-then statements to complete this. Or sort the row and manually input.
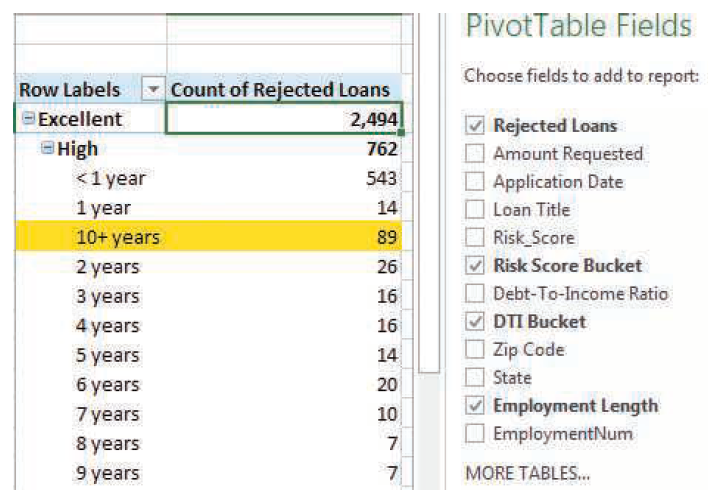
Run a PivotTable analysis that shows the number of loans in each risk score bucket. Which group had the most rejected loans (biggest count)? Which group had the least rejected loans (smallest count)? This is the deliverable. Is it similar to Exhibit 1-11 performed on years 2007–2012?
Exhibit 1-11
Step by Step Answer:
Here is the pivot table by risk score grouping Row Labels Count of Loan Title ...View the full answer