

Rewrite the pond life program from Figure 13.10 so that the output is presented as a graph
Question:
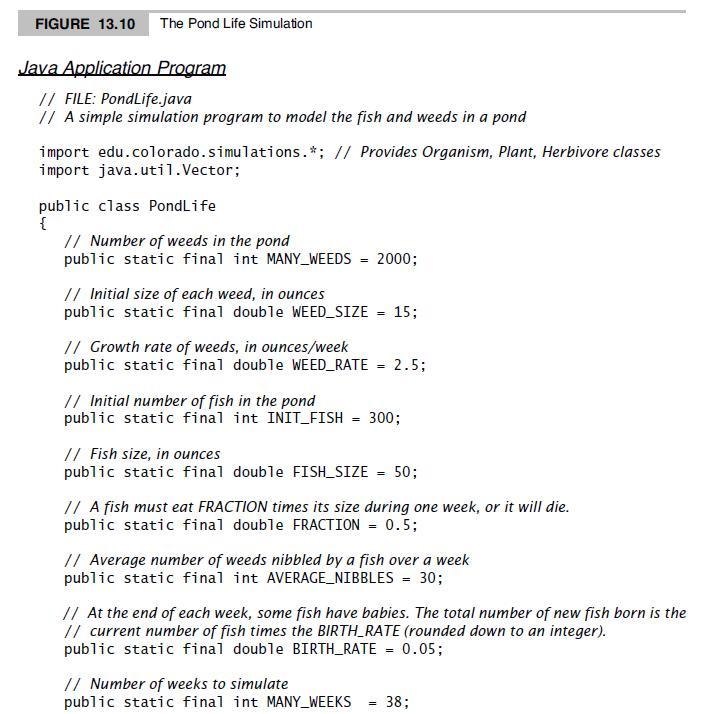
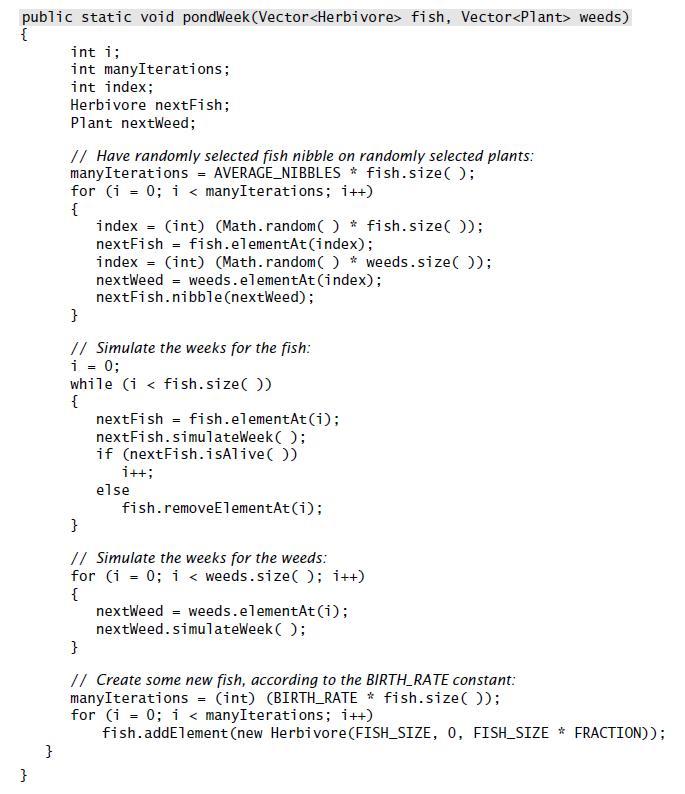
Rewrite the pond life program from Figure 13.10 so that the output is presented as a graph in an applet window. The applet can use most of the same graphing techniques as the fractal applet from page 426 in Chapter 8. You should use different colors for graphing the populations of the weeds and the fish.

Transcribed Image Text:
FIGURE 13.10 The Pond Life Simulation Java Application Program // FILE: PondLife.java // A simple simulation program to model the fish and weeds in a pond import edu.colorado.simulations.*; // Provides Organism, Plant, Herbivore classes import java.util.Vector; public class PondLife { // Number of weeds in the pond public static final int MANY_WEEDS = 2000; // Initial size of each weed, in ounces public static final double WEED_SIZE = 15; // Growth rate of weeds, in ounces/week public static final double WEED_RATE 2.5; // Initial number of fish in the pond public static final int INIT_FISH = 300; // Fish size, in ounces public static final double FISH_SIZE = 50; // A fish must eat FRACTION times its size during one week, or it will die. public static final double FRACTION = 0.5; // Average number of weeds nibbled by a fish over a week public static final int AVERAGE_NIBBLES = 30; // At the end of each week, some fish have babies. The total number of new fish born is the // current number of fish times the BIRTH_RATE (rounded down to an integer). public static final double BIRTH_RATE = 0.05; // Number of weeks to simulate public static final int MANY_WEEKS 38;
Fantastic news! We've Found the answer you've been seeking!
Step by Step Answer:
Answer rating: 57% (14 reviews)
import javaawt import javaappletApplet public class PondLifeApplet extends Applet private static fin...View the full answer

Related Book For 
Question Posted:
Students also viewed these Computer science questions
-
Rewrite the pond life program from Figure 13.10 so that the values declared at the start of the program are no longer constant. The programs user should be able to enter values for all of these...
-
A point travels along the x axis with a velocity whose projection vx is presented as a function of time by the plot in Fig.1.3. Assuming the coordinate of the point x = 0 at the moment t = 0, draw...
-
BACKGROUND You are an information analyst working for NEE. The company president has asked you to prepare a Quantitative analysis of financial, sales, and operations data to help determine which...
-
Build a circuit on a breadboard from the circuit diagram of the two loop-network circuits: www R
-
You plan to conduct a survey on your campus. What is wrong with selecting every 50th student leaving the cafeteria?
-
Assume the same facts as in Problem 1:8-34. In addition, assume that in 2020, Angela receives an additional $7,000 in a settlement of a lawsuit arising because of the snow-skiing accident. $4,000 of...
-
A flywheel for energy storage is modeled as a rotating thin-walled cylindrical ring (t r) as shown in Figure 1.7. Find the equation for the tensile stress in the ring as a function of the mean...
-
The Burnet County Road Authority was established as a separate government to maintain county highways. The road authority was granted statutory power to impose property taxes on county residents to...
-
We have a non-rotating space station in the shape of a long thin uniform rod of mass 4.45 x 10^6 kg and length 1387 meters. Small probes of mass 9598 kg are periodically launched in pairs from two...
-
According to the website of the American Association for Justice,11 Stella Liebeck of Albuquerque, New Mexico, was severely burned by McDonalds coffee in February 1992. Liebeck, who re-ceived third-...
-
A set is like a bag, except that a set does not allow multiple copies of any element. If you try to insert a new copy of an item that is already present in a set, then the set simply remains...
-
Extend the Organism object hierarchy from Section 13.3 so that there is a new class Carnivore as described in Self-Test Exercise 13 on page 710. Use the hierarchy in a model of life on a small island...
-
A 91-kg machine element supported by four springs, each of constant 175 N/m, is subjected to a periodic force of frequency 0.8 Hz and amplitude 89 N. Determine the amplitude of the fluctuating force...
-
How do we tell if a Find operation on a map was successful?
-
Give arguments for and against using functions (such as Swap) to encapsulate frequently used code in a sorting routine.
-
A priority queue is implemented as a heap: 1. Show how the heap would look after this series of operations: 2. What would the values of x, y, and z be after the series of operations in part (a)? 25...
-
1. What is the height of the tree? 2. What nodes are on Level 3? 3. Which levels have the maximum number of nodes that they could contain? 4. What is the maximum height of a binary search tree...
-
Read the code segment and fill in blank #24. 1. false 2. true 3. predLoc == NULL 4. location != NULL 5. answer not shown 4 Class Unsorted Type { public: //all the prototypes go here. private: int...
-
Martha was considering starting a new business. During her preliminary investigations related to the new venture, she incurred the following expenditures. Salaries...
-
A report from the college dean indicates that for the previous semester, the grade distribution for the Department of Psychology included 135 As, 158 Bs, 140 Cs, 94 Ds, and 53 Fs. Determine what kind...
-
Consider the inheritance of classes from Exercise R-2.12, and let d be an object variable of type Horse. If d refers to an actual object of type Equestrian, can it be cast to the class Racer? Why or...
-
Give an example of a Java code fragment that performs an array reference that is possibly out of bounds, and if it is out of bounds, the program catches that exception and prints the following error...
-
If the parameter to the makePayment method of the CreditCard class (see Code Fragment 1.5) were a negative number, that would have the effect of raising the balance on the account. Revise the...
-
The following table show a mass diagram ordinates of a highway construction project. If the free haul distance is 600 ft and overhaul cost is $15 per station yard; a. Draw the mass diagram. Use the...
-
Describe a time when you took personal accountability for a conflict and initiated contact with the individual(s) involved to explain your actions. What steps did you take? What was the result?
-
Examine the role of process intensification in developing sustainable and environmentally friendly processes, considering the potential for using renewable feedstocks, reducing waste and emissions,...

Study smarter with the SolutionInn App