

Consider the star schema from Figure 11.2. Suppose an analyst finds that monthly total sales (sum of
Question:
Consider the star schema from Figure 11.2. Suppose an analyst finds that monthly total sales (sum of the price values of all sales tuples) have decreased, instead of growing, from April 2018 to May 2018. The analyst wishes to check if there are specific item categories, stores, or customer countries that are responsible for the decrease.
a. What are the aggregates that the analyst would start with, and what are the relevant drill-down operations that the analyst would need to execute?
b. Write an SQL query that shows the item categories that were responsible for the decrease in sales, ordered by the impact of the category on the sales decrease, with categories that had the highest impact sorted first.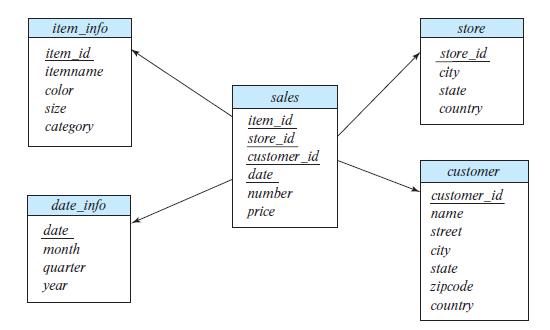
Step by Step Answer:
For this question we will assume that the analyst is only interested in ...View the full answer


Database System Concepts
ISBN: 9780078022159
7th Edition
Authors: Abraham Silberschatz, Henry F. Korth, S. Sudarshan
