

An investor has a long position in a nondividend-paying stock, and, additionally, has a long collar on
Question:
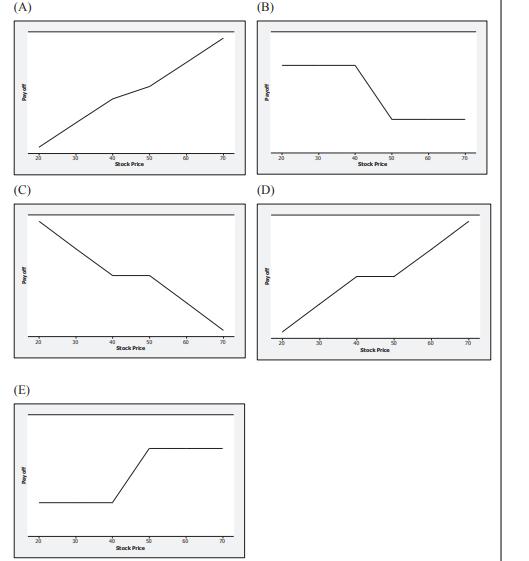
An investor has a long position in a nondividend-paying stock, and, additionally, has a long collar on this stock consisting of a 40-strike put and 50-strike call.
Determine which of these graphs represents the payoff diagram for the overall position at the time of expiration of the options.
Fantastic news! We've Found the answer you've been seeking!
Step by Step Answer:
E We determine the shape of the collared stock by looking at ...View the full answer

Answered By
Allan Simiyu
I am an adroit Writer. I am a dedicated writer having worked as a writer for 3 years now. With this, I am sure to ace in the field by helping students break down abstract concepts into simpler ideas.
8+ Reviews
54+ Question Solved
Related Book For 

Question Posted:
