

This question uses data from 500 randomly selected adults in the larger NHANES dataset. Poverty is measured
Question:
This question uses data from 500 randomly selected adults in the larger NHANES dataset. Poverty is measured as a ratio of family income to poverty guidelines. Smaller numbers indicate more poverty, and ratios of 5 or larger were recorded as 5 . The Education variable indicates the highest level of education achieved: either 8th grade, 9-11th grade, high school, some college, or college grad.
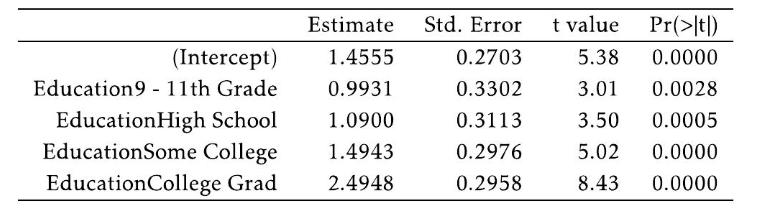
In this model, the residual standard error is 1.46 , the \(F\)-statistic is 28.09 with 4 and 456 degrees of freedom; \(P\left(F_{4,456}>28.09\right)
(a) Write the estimated model equation.
(b) Calculate the predicted poverty ratio for an individual who at most completed high school.
(c) Interpret the estimated intercept value.
(d) Interpret the slope coefficient for EducationCollege Grad, and describe the tested hypotheses that correspond to the \(p\)-value for this slope coefficient.
(e) Assess whether educational level, overall, is associated with poverty. Be sure to include any relevant numerical evidence as part of your answer.
Step by Step Answer:


Introductory Statistics For The Life And Biomedical Sciences
ISBN: 9781943450121
1st Edition
Authors: Julie Vu, David Harrington
