

An experiment was run to determine whether four specific firing temperatures affect me density of a certain
Question:
An experiment was run to determine whether four specific firing temperatures affect me density of a certain type of brick. The experiment led to the following data:
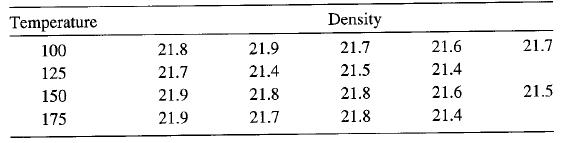
(a) Does the firing temperature affect the density of the bricks? Use α = 0.05.
(b) Is it appropriate to compare the means using Duncan's multiple range test (for ex-ample) in this experiment?
(c) Analyze the residuals from this experiment. Are the analysis of variance assumptions satisfied?
(d) Construct a graphical display of the treatment as described in Section 3-5.3. Does this graph adequately summarize the results of the analysis of variance in part (a)?
Fantastic news! We've Found the answer you've been seeking!
Step by Step Answer:
The given data can be entered in Excel since there are four levels of temperature so to find the sig...View the full answer

Answered By
ABEL ANGAYA
I completed my graduation in Physics from Mahatma Gandhi university Kottayam and completed my Bachelor of Education in Physical science from Choudhary Devilal university Haryana . For the last five years am working as a trained graduate teacher in a CBSE affiliated school in Rajasthan
0 Reviews
10+ Question Solved
Related Book For 

Question Posted:
