

The deflection temperature under load for two different formulations of ABS plastic pipe is being studied. Two
Question:
The deflection temperature under load for two different formulations of ABS plastic pipe is being studied. Two samples of 12 observations each are prepared using each formulation and the deflection temperatures (in °F) are reported below:
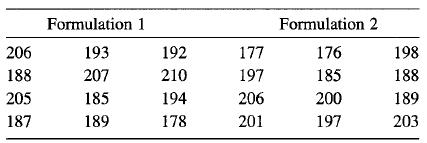
(a) Construct normal probability plots for both samples. Do these plots support assumptions of normality and equal variance for both samples?
(b) Does the data support the claim that the mean deflection temperature under load for formulation 1 exceeds that of formulation 2? Use α = 0.05.
(c) What is the P-value for the test in part (a)?
Fantastic news! We've Found the answer you've been seeking!
Step by Step Answer:
a To construct normal probability plots the data must be plotted against a theoretical normal distri...View the full answer

Answered By
FELIX NYAMBWOGI
I have been tutoring for over 5 years, both in person and online. I have experience tutoring a wide range of subjects, including math, science, English, and history. I have also worked with students of all ages, from elementary school to high school.
In addition, I have received training in effective tutoring strategies and techniques, such as active listening, questioning, and feedback. I am also proficient in using online tutoring platforms, such as Zoom and Google Classroom, to effectively deliver virtual lessons.
Overall, my hands-on experience and proficiency as a tutor has allowed me to effectively support and guide students in achieving their academic goals.
0 Reviews
10+ Question Solved
Related Book For 

Question Posted:
