

Plot the ratio of the frequency responses (in decibels) and phase versus for the data holds of
Question:
Plot the ratio of the frequency responses (in decibels) and phase versus for the data holds of Problems 3.7-8 and 3.7-9. Note the effect on phase of making the data hold realizable.
Problems 3.7-8
A polygonal data hold is a device that reconstructs the sampled signal by the straight-line approximation shown in Fig. P3.7-8. Show that the transfer function of this data hold is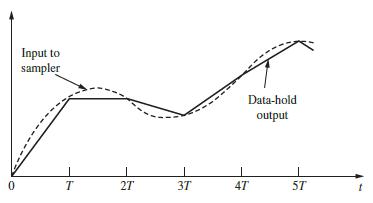
Problems 3.7-9
A data hold is to be constructed that reconstructs the sampled signal by the straight-line approximation shown in Fig. P3.7-9. Note that this device is a polygonal data hold with a delay of T seconds. Derive the transfer function for this data hold. Is this data hold physically realizable?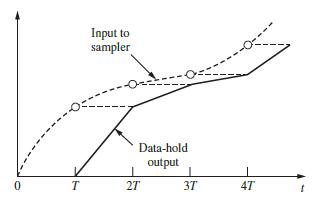
Step by Step Answer:
From Problem 319 a...View the full answer


Digital Control System Analysis And Design
ISBN: 9780132938310
4th Edition
Authors: Charles Phillips, H. Nagle, Aranya Chakrabortty
