

Shown in Fig. P3.7-12 is the output of a data hold that clamps the output to the
Question:
Shown in Fig. P3.7-12 is the output of a data hold that clamps the output to the input for the first half of the sampling period, and returns the output to a value of zero for the last half of the sampling period.
(a) Find the transfer function of this data hold.
(b) Plot the frequency response of this data hold.
(c) Comparing this frequency response to that of the zero-order hold, comment on which would be better for data reconstruction.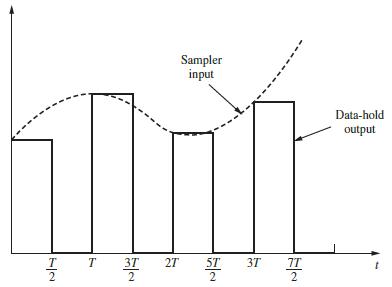
Fantastic news! We've Found the answer you've been seeking!
Step by Step Answer:
a T1 00u1 utZ 0Tu11u127 2 Ts 2 01 eT S S E s e0 G s 1 S G jw18 j...View the full answer

Answered By
Sufiyan Ahmed Tariq
I am a Chartered Accountant and an Associate Public & Finance Accountant. I also hold a bachelors of Commerce degree. I have over 8 years of experience in accounting, finance and auditing. Through out my career, I have worked with many leading multinational organisation.
I have helped a number of students in studies by teaching them key concepts of subjects like accounting, finance, corporate law and auditing. I help students understanding the complex situation by providing them daily life examples.
I can help you in the following subject / areas:
a) Accounting;
b) Finance;
c) Commerce;
d) Auditing; and
e) Corporate Law.
7+ Reviews
17+ Question Solved
Related Book For 
Digital Control System Analysis And Design
ISBN: 9780132938310
4th Edition
Authors: Charles Phillips, H. Nagle, Aranya Chakrabortty
Question Posted:
