

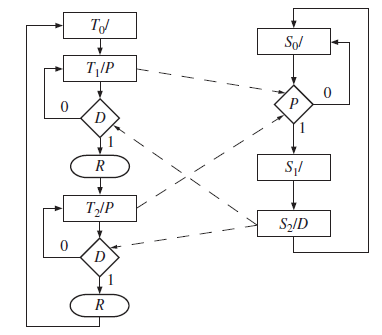
SM charts for two linked state machines are shown here. Machine T starts in state T 0
Question:
Fantastic news! We've Found the answer you've been seeking!
Step by Step Answer:
CLK TPRSO ...View the full answer

Answered By
Bhartendu Goyal
Professional, Experienced, and Expert tutor who will provide speedy and to-the-point solutions. I have been teaching students for 5 years now in different subjects and it's truly been one of the most rewarding experiences of my life. I have also done one-to-one tutoring with 100+ students and help them achieve great subject knowledge. I have expertise in computer subjects like C++, C, Java, and Python programming and other computer Science related fields. Many of my student's parents message me that your lessons improved their children's grades and this is the best only thing you want as a tea...
2+ Reviews
10+ Question Solved
Related Book For 

Digital Systems Design Using Verilog
ISBN: 978-1285051079
1st edition
Authors: Charles Roth, Lizy K. John, Byeong Kil Lee
Question Posted:
