

On the sine wave of Figure 11-38(b), mark the points where samples are taken by a flash
Question:
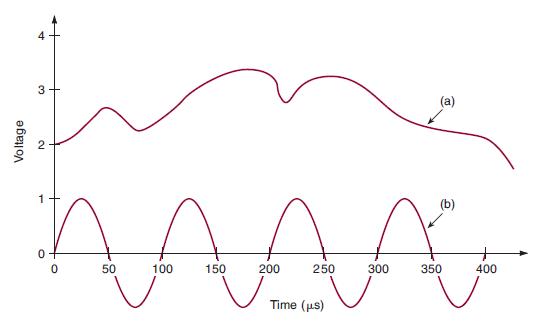
On the sine wave of Figure 11-38(b), mark the points where samples are taken by a flash A/D converter at intervals of 75 μs (starting at the origin). Then draw the reconstructed output from the D/A converter (connect the sample points with straight lines to show filtering). Calculate the sample frequency, the sine input frequency, and the difference between them. Then compare to the resulting reconstructed waveform frequency.
Figure 11-38
Step by Step Answer:

This question has not been answered yet.
You can Ask your question!
Related Book For 

Digital Systems Principles And Application
ISBN: 9780134220130
12th Edition
Authors: Ronald Tocci, Neal Widmer, Gregory Moss
Question Posted:
