

Figure 2.22 shows a similar study to that in Task 9, but the means were 10 (singing)
Question:
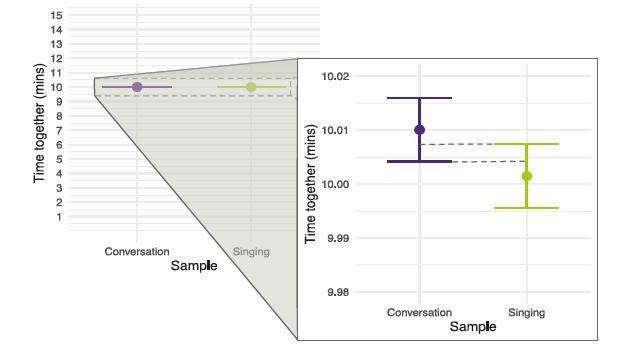
Figure 2.22 shows a similar study to that in Task 9, but the means were 10 (singing) and 10.01 (conversation), the standard deviations in both groups were 3 and each group contained 1 million people. Compute the values of the confidence intervals displayed in the figure.
Fantastic news! We've Found the answer you've been seeking!
Step by Step Answer:

Answered By
Saleem Abbas
Have worked in academic writing for an a years as my part-time job.
1+ Reviews
10+ Question Solved
Related Book For 
Discovering Statistics Using IBM SPSS Statistics
ISBN: 9781529630008
6th Edition
Authors: Andy Field
Question Posted:
