

Using the pets.sav data from Chapter 4 (Task 6), plot two error bar charts comparing scores when
Question:
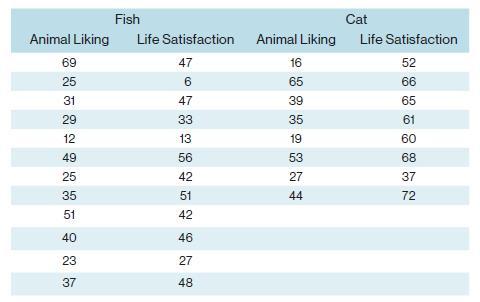
Using the pets.sav data from Chapter 4 (Task 6), plot two error bar charts comparing scores when having a fish or cat as a pet (x-axis): one for the animal liking variable and the other for the life satisfaction.
Chapter 4 Task 6
I wondered whether a fish or cat made a better pet. I found some people who had either fish or cats as pets and measured their life satisfaction and how much they like animals. Enter these data into SPSS and save as pets.sav.
Step by Step Answer:

This question has not been answered yet.
You can Ask your question!
Related Book For 
Discovering Statistics Using IBM SPSS Statistics
ISBN: 9781529630008
6th Edition
Authors: Andy Field
Question Posted:
