

From the quarterly data for the period 19501960, F. P. R. Brechling obtained the following demand function
Question:
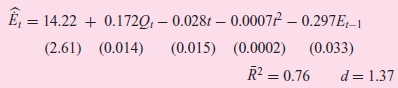
where EÌ‚t = (Et ˆ’ Etˆ’1)
Q = output
t = time
The preceding equation was based on the assumption that the desired level of employment Eˆ—t is a function of output, time, and time squared and on the hypothesis that Et ˆ’ Etˆ’1 = δ(Eˆ—t ˆ’ Etˆ’1), where δ, the coefficient of adjustment, lies between 0 and 1.
a. Interpret the preceding regression.
b. What is the value of δ?
c. Derive the long-run demand function for labor from the estimated short-run demand function.
d. How would you test for serial correlation in the preceding model?
Fantastic news! We've Found the answer you've been seeking!
Step by Step Answer:
a On average over the sample period the change in employment is positively related to output negativ...View the full answer

Answered By
Carly Cimino
As a tutor, my focus is to help communicate and break down difficult concepts in a way that allows students greater accessibility and comprehension to their course material. I love helping others develop a sense of personal confidence and curiosity, and I'm looking forward to the chance to interact and work with you professionally and better your academic grades.
12+ Reviews
21+ Question Solved
Related Book For 

Question Posted:
