

Refer to Example 8.3. Use the t test as shown in Eq. (8.6.4) to find out if
Question:
In Example 8.3
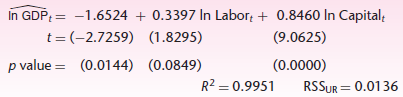
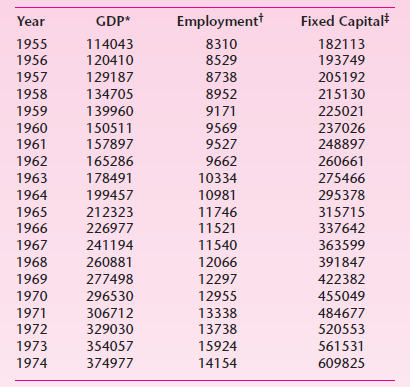
By way of illustrating the preceding discussion, consider the data given in the following table. Attempting to fit the Cobb€“Douglas production function to these data yielded the following results:
Fantastic news! We've Found the answer you've been seeking!
Step by Step Answer:
To use the t test given in 874 we need to know the covariance between the two slope es...View the full answer

Answered By
Fahmin Arakkal
Tutoring and Contributing expert question and answers to teachers and students.
Primarily oversees the Heat and Mass Transfer contents presented on websites and blogs.
Responsible for Creating, Editing, Updating all contents related Chemical Engineering in
latex language
8+ Reviews
22+ Question Solved
Related Book For 

Question Posted:
