

Refer to the data in the following table. a. Let Y = eggs produced (in millions) and
Question:
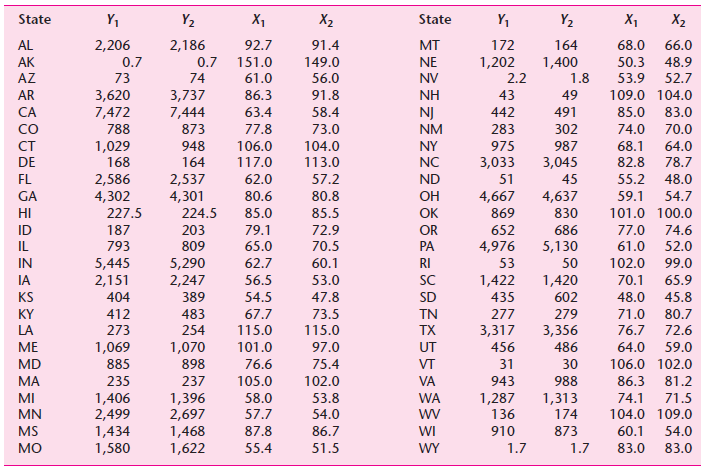
a. Let Y = eggs produced (in millions) and X = price of eggs (cents per dozen). Estimate the model for the years 1990 and 1991 separately.
b. Pool the observations for the two years and estimate the pooled regression. What assumptions are you making in pooling the data?
c. Use the fixed effects model, distinguishing the two years, and present the regression results.
d. Can you use the fixed effects model, distinguishing the 50 states? Why or why not?
e. Would it make sense to distinguish both the state effect and the year effect? If so, how many dummy variables would you have to introduce?
f. Would the error components model be appropriate to model the production of eggs? Why or why not? See if you can estimate such a model using, say, EViews.
Step by Step Answer:
a Year Intercept slope R 2 d 1990 3118484 224984 00834 198 35718 20894 1991 3149356 233485 00972 19 ...View the full answer


