Suppose a researcher collects data on houses that have sold in a particular neighborhood over the past
Question:
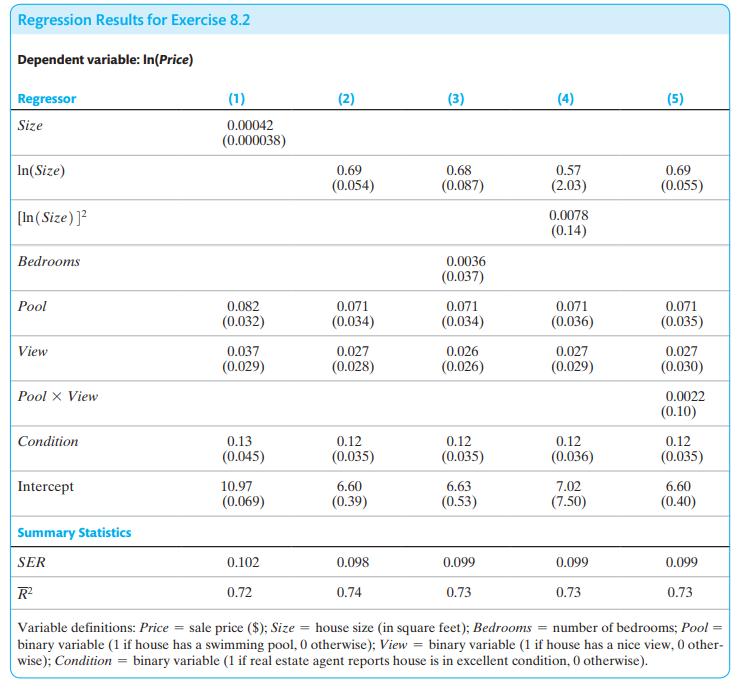
Suppose a researcher collects data on houses that have sold in a particular neighborhood over the past year and obtains the regression results in the table shown below.
a. Using the results in column (1), what is the expected change in price of building a 500 -square-foot addition to a house? Construct a \(95 \%\) confidence interval for the percentage change in price.
b. Comparing columns (1) and (2), is it better to use Size or \(\ln (\) Size) to explain house prices?
c. Using column (2), what is the estimated effect of a pool on price? (Make sure you get the units right.) Construct a \(95 \%\) confidence interval for this effect.
d. The regression in column (3) adds the number of bedrooms to the regression. How large is the estimated effect of an additional bedroom? Is the effect statistically significant? Why do you think the estimated effect is so small? (Hint: Which other variables are being held constant?)
e. Is the quadratic term \(\ln (\text { Size })^{2}\) important?
f. Use the regression in column (5) to compute the expected change in price when a pool is added to a house that doesn't have a view. Repeat the exercise for a house that has a view. Is there a large difference? Is the difference statistically significant?
Step by Step Answer: