Question:
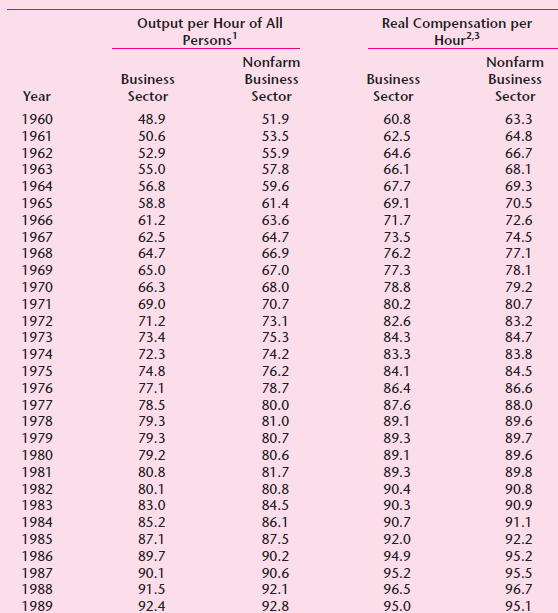
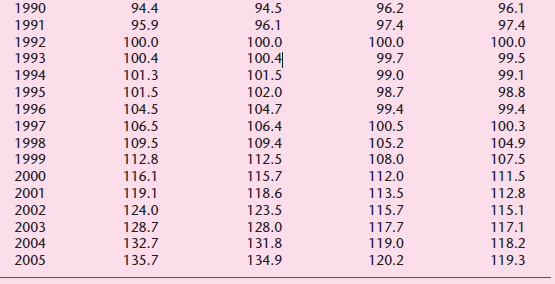
Table 3.6 gives data on indexes of output per hour (X) and real compensation per hour (Y) for the business and nonfarm business sectors of the U.S. economy for 19602005. The base year of the indexes is 1992 = 100 and the indexes are seasonally adjusted.
a. Plot Y against X for the two sectors separately.
b. What is the economic theory behind the relationship between the two variables? Does the scattergram support the theory?
c. Estimate the OLS regression of Y on X. Save the results for a further look after we study Chapter 5.
Transcribed Image Text:
Output per Hour of All Persons' Real Compensation per Hour23 Nonfarm Nonfarm Business Business Business Business Year Sector Sector Sector Sector 1960 48.9 51.9 60.8 63.3 53.5 1961 50.6 62.5 64.8 66.7 68.1 1962 52.9 55.9 64.6 1963 55.0 57.8 66.1 67.7 1964 56.8 59.6 69.3 1965 58.8 61.4 69.1 70.5 1966 61.2 63.6 71.7 72.6 1967 62.5 64.7 73.5 74.5 64.7 1968 66.9 76.2 77.1 1969 65.0 67.0 77.3 78.1 68.0 79.2 1970 66.3 78.8 70.7 1971 69.0 80.2 80.7 1972 1973 71.2 73.1 82.6 83.2 75.3 84.7 73.4 84.3 1974 72.3 74.2 83.3 83.8 1975 84.1 74.8 76.2 84.5 86.4 1976 77.1 78.7 86.6 1977 1978 78.5 80.0 87.6 88.0 89.1 79.3 81.0 89.6 1979 79.3 80.7 89.3 89.7 1980 79.2 80.6 89.1 89.6 89.3 1981 80.8 81.7 89.8 90.4 1982 80.1 80.8 90.8 90.9 1983 83.0 84.5 90.3 1984 85.2 86.1 87.5 90.7 91.1 92.2 95.2 1985 87.1 92.0 1986 89.7 90.2 94.9 1987 90.1 90.6 95.2 95.5 1988 91.5 92.1 96.5 96.7 1989 95.1 92.4 92.8 95.0 1990 94.4 94.5 96.2 96.1 1991 95.9 96.1 97.4 97.4 1992 100.0 100.0 100.0 100.0 100.4| 101.5 1993 100.4 99.7 99.5 1994 101.3 99.0 99.1 1995 101.5 102.0 98.7 98.8 1996 104.5 104.7 99.4 99.4 1997 106.5 106.4 100.5 100.3 1998 109.5 109.4 105.2 104.9 1999 112.8 112.5 108.0 107.5 2000 116.1 115.7 112.0 111.5 2001 119.1 118.6 113.5 112.8 2002 124.0 123.5 115.7 115.1 2003 128.7 128.0 117.7 117.1 132.7 131.8 134.9 2004 119.0 118.2 2005 135.7 120.2 119.3