

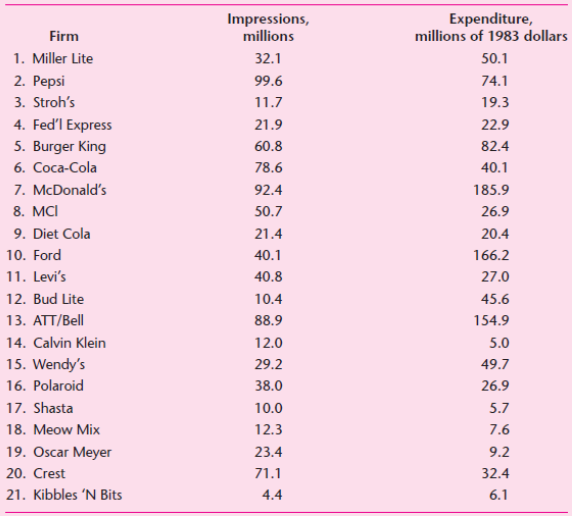
The data presented in Table 1.6 were published in the March 1, 1984, issue of The Wall
Question:
a. Plot impressions on the vertical axis and advertising expenditure on the horizontal axis.
b. What can you say about the nature of the relationship between the two variables?
c. Looking at your graph, do you think it pays to advertise? Think about all those commercials shown on Super Bowl Sunday or during the World Series.
Fantastic news! We've Found the answer you've been seeking!
Step by Step Answer:
a b c As the following figure shows there seems to ...View the full answer

Answered By
Chiranjib Thakur
I have no tutoring experience yet, but I can share my skills and knowledge gained from my education and work experiences. I have been a CPA since 2012 with 6 years of work experience in internal auditing and 4 years of work experience in accounting at the supervisory level.
1+ Reviews
10+ Question Solved
Related Book For 

Question Posted:
