Question:
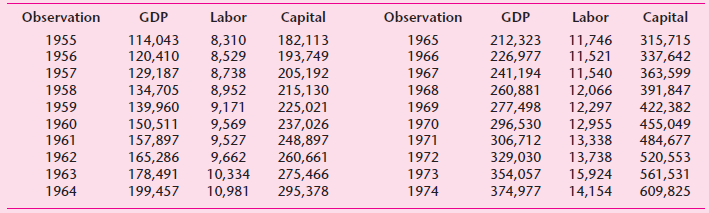
The following table gives data on real GDP, labor, and capital for Mexico for the period 19551974. See if the multiplicative CobbDouglas production function given in Eq. (14.1.2a) fits these data. Compare your results with those obtained from fitting the additive CobbDouglas production function given in Eq. (14.1.4), whose results are given in Example 14.2. Which is a better fit?
Transcribed Image Text:
Observation 1965 1966 1967 Labor 11,746 11,521 11,540 12,066 12,297 12,955 13,338 13,738 15,924 14,154 Observation 1955 1956 1957 1958 1959 GDP 114,043 Labor Capital Capital 315,715 337,642 363,599 391,847 422,382 455,049 484,677 520,553 561,531 609,825 GDP 212,323 226,977 241,194 260,881 277,498 8,310 182,113 8,529 8,738 8,952 9,171 9,569 9,527 9,662 10,334 10,981 193,749 205,192 120,410 129,187 134,705 215,130 225,021 237,026 248,897 260,661 275,466 295,378 1969 1970 1971 1972 1973 1974 139,960 150,511 296,530 306,712 329,030 354,057 1961 1962 1963 165,286 178,491 1964 199,457