

Use the data in PresVote.dta to answer the following questions about the relationship between changes in real
Question:
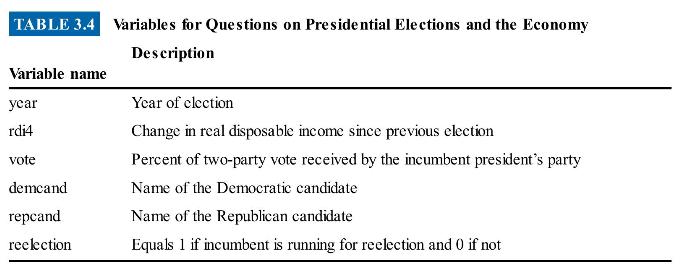
Use the data in PresVote.dta to answer the following questions about the relationship between changes in real disposable income and presidential election results. Table 3.4 describes the variables.
(a) Create a scatterplot like Figure 3.1.
(b) Estimate an OLS regression in which the vote share of the incumbent party is regressed on change in real disposable income. Report the estimated regression equation, and interpret the coefficients.
Figure 3.1:
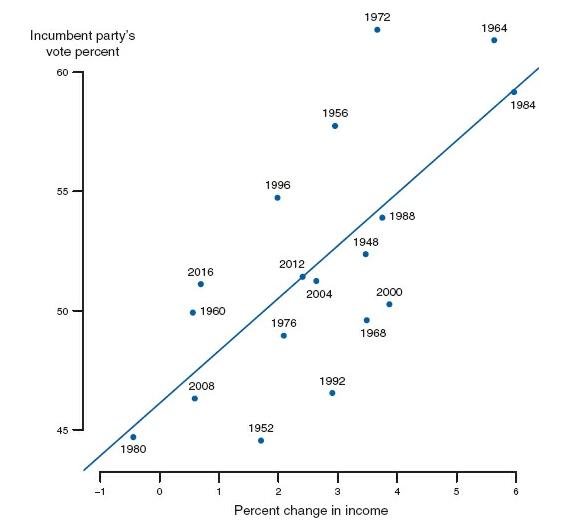
(c) What is the fitted value for 1996? For 1972?
(d) What is the residual for 1996? For 1972?
(e) Estimate an OLS regression only on years in which the variable Reelection equals 1-that is, years in which an incumbent president is running for reelection. Interpret the coefficients.
(f) Estimate an OLS regression only on years in which the variable Reelection equals 0 - that is, years in which an incumbent president is not running for reelection. Interpret the coefficients, and discuss the substantive implications of differences from the model with incumbents only.
Step by Step Answer:


Real Econometrics The Right Tools To Answer Important Questions
ISBN: 9780190857462
2nd Edition
Authors: Michael Bailey
