

a. Draw a graph of Yucatans PPF and explain how your graph illustrates a tradeoff. b. If
Question:
a. Draw a graph of Yucatan’s PPF and explain how your graph illustrates a tradeoff.
b. If Yucatan produces 150 pounds of food per month, how much sunscreen must it produce if it achieves production efficiency?
c. What is Yucatan’s opportunity cost of producing
(i) 1 pound of food and (ii) 1 gallon of sunscreen?
d. What is the relationship between your answers to part (c)?
Suppose that Yucatan’s production possibilities are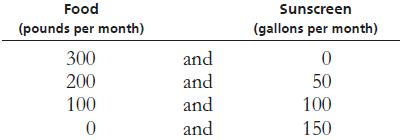
Step by Step Answer:

This question has not been answered yet.
You can Ask your question!
Related Book For 
Question Posted:
