

Consider the data of a fictitious country in the following table: a. In both years, actual real
Question:
Consider the data of a fictitious country in the following table:
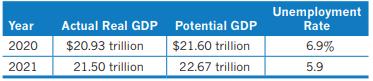
a. In both years, actual real GDP is lower than potential GDP. Briefly explain how this is possible.
b. The actual real GDP in 2021 is slightly higher than that in 2020, and the unemployment rate decreased from 2020 to 2021. Why?
c. Is the inflation rate likely to be higher in 2021 than it was in 2020? Is the economic crisis caused by the COVID-19 pandemic a result of a change in a component of aggregate demand or by a supply shock?
Fantastic news! We've Found the answer you've been seeking!
Step by Step Answer:

Answered By
PALASH JHANWAR
I am a Chartered Accountant with AIR 45 in CA - IPCC. I am a Merit Holder ( B.Com ). The following is my educational details.
PLEASE ACCESS MY RESUME FROM THE FOLLOWING LINK: https://drive.google.com/file/d/1hYR1uch-ff6MRC_cDB07K6VqY9kQ3SFL/view?usp=sharing
3+ Reviews
10+ Question Solved
Related Book For 

Question Posted:
