

Consider the information in the following table: a. Explain the changes that occurred between 2008 and 2010.
Question:
Consider the information in the following table:
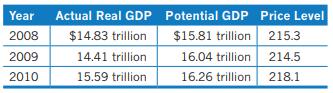
a. Explain the changes that occurred between 2008 and 2010.
b. Draw a dynamic aggregate demand and aggregate supply graph to illustrate what happened between 2008 and 2010. Your graph should contain the AD, SRAS, and LRAS curves and indicate the short-run macroeconomic equilibrium and directions in which the curves shifted.
Step by Step Answer:

This question has not been answered yet.
You can Ask your question!
Related Book For 

Question Posted:
