

The following table presents data from a tourism operator on the average price of ocean cruise travel
Question:
The following table presents data from a tourism operator on the average price of ocean cruise travel for one week and the number of ocean cruise passengers in 2018 and 2019.
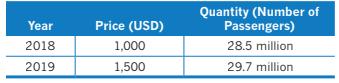
a. Calculate the price elasticity of the demand for ocean cruise travel. Use the midpoint formula for your calculation.
b. Calculate the change in quantity demanded in millions of cruises divided by the change in price.
c. Compare the values obtained in parts (a) and (b). What do you notice?
Fantastic news! We've Found the answer you've been seeking!
Step by Step Answer:

Answered By
Jinah Patricia Padilla
Had an experience as an external auditor in Ernst & Young Philippines and currently a Corporate Accountant in a consultancy company providing manpower to a 5-star hotel in Makati, Philippines, Makati Diamond Residences
120+ Reviews
150+ Question Solved
Related Book For 

Question Posted:
