

The management of Could Do Better has asked you to explain the concept of weighted average cost
Question:
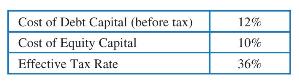
The management of Could Do Better has asked you to explain the concept of weighted average cost of capital. In particular, they are confused that you are encouraging the use of debt capital to fund projects even though the CFO's data shows that the cost of debt capital is higher than the cost of equity capital. The CFO's data are shown below.
a. In preparation for your presentation, you create a graph whose \(x\)-axis is Percent of Funds from Debt Capital from 0 to 100 with a step size of 10. The \(y\)-axis is Cost of Capital. There are five curves on your chart: (1) Cost of Debt Capital before Tax, (2) Cost of Equity Capital, (3) Cost of Debt Capital After Tax, (4) Weighted Average Cost of Capital Before Tax, and (5) Weighted Average Cost of Capital After Tax.
b. Using your chart, (i) explain why the end points of curves (4) and (5) fall where they do, (ii) explain why one of the slopes of curves (4) and (5) is positive and one is negative, and (iii) defend your recommendation encouraging the use of debt capital.
Step by Step Answer:
ANSWER The graph has the following curves Cost of Debt Capital Before Tax This curve represents the cost of debt financing before considering taxes It ...View the full answer


Principles Of Engineering Economic Analysis
ISBN: 9781118163832
6th Edition
Authors: John A. White, Kenneth E. Case, David B. Pratt
