

Use the following data to work Problems. Draw a graph that shows the relationship between the two
Question:
Use the following data to work Problems. Draw a graph that shows the relationship between the two variables x and y: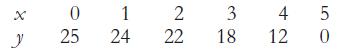
a. Is the relationship positive or negative?
b. Does the slope of the relationship become steeper or flatter as the value of x increases?
c. Think of some economic relationships that might be similar to this one.
Fantastic news! We've Found the answer you've been seeking!
Step by Step Answer:
Based on the data youve provided Ill walk you through how to approach these questions step by step a ...View the full answer

Answered By
ANDREW KIPRUTO
Academic Writing Expert
I have over 7 years of research and application experience. I am trained and licensed to provide expertise in IT information, computer sciences related topics and other units like chemistry, Business, law, biology, biochemistry, and genetics. I'm a network and IT admin with +8 years of experience in all kind of environments.
I can help you in the following areas:
Networking
- Ethernet, Wireless Airmax and 802.11, fiber networks on GPON/GEPON and WDM
- Protocols and IP Services: VLANs, LACP, ACLs, VPNs, OSPF, BGP, RADIUS, PPPoE, DNS, Proxies, SNMP
- Vendors: MikroTik, Ubiquiti, Cisco, Juniper, HP, Dell, DrayTek, SMC, Zyxel, Furukawa Electric, and many more
- Monitoring Systems: PRTG, Zabbix, Whatsup Gold, TheDude, RRDtoo
Always available for new projects! Contact me for any inquiries
1+ Reviews
10+ Question Solved
Related Book For 

Question Posted:
