The following table shows data on asthma-related visits. Is there evidence that these visits vary by quarter?
Question:
The following table shows data on asthma-related visits. Is there evidence that these visits vary by quarter? Can you detect a trend?
A powerful test would be to run a multiple regression in Excel. (To do this, you will need the free Analysis ToolPak for your version of Excel. Microsoft [2018] offers guidance on how to load and use the Analysis ToolPak.) To test for quarterly differences, create a variable called Q1 that equals 1 if the data are for the first quarter and 0 otherwise, a variable called Q2 that equals 1 if the data are for the second quarter and 0 otherwise, and a variable called Q4 that equals 1 if the data are for the fourth quarter and 0 otherwise. (Because you will accept the default, which is to have a constant term in your regression equation, do not include an indicator variable for Quarter 3.) Also create a variable called Trend that increases by 1 each quarter.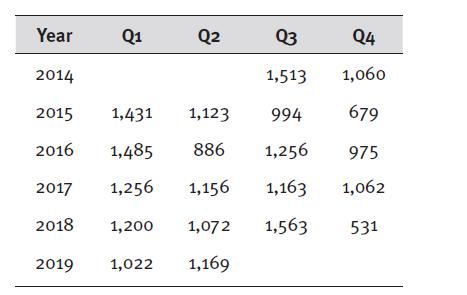
Step by Step Answer: