

Refer to Figure 21-1. Get the quarterly CANSIM data from 1968 to 2009 for the real GDP
Question:
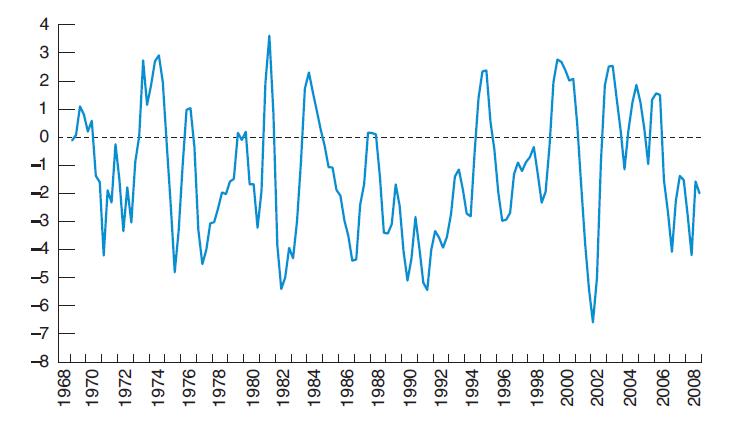
Refer to Figure 21-1. Get the quarterly CANSIM data from 1968 to 2009 for the real GDP (series V41707150), GDP deflator (series V1997756), and M2 (gross; series V41552801) from the Textbook Resources area of the MyEconLab.
a. Compute the velocity of money (don't forget to calculate the nominal GDP!), plot this series, and comment on its long-term behaviour.
b. Compare the calculated velocity of money to its level in 2005. Has it risen or fallen? Suggest reasons for its change since that time.
Figure 21-1
Step by Step Answer:

This question has not been answered yet.
You can Ask your question!
Related Book For 
The Economics Of Money Banking And Financial Markets
ISBN: 9780321584717
4th Canadian Edition
Authors: Frederic S. Mishkin, Apostolos Serletis
Question Posted:
