Suppose that in a later market period, the quantities supplied in the table in Problem 3-1 are
Question:
Suppose that in a later market period, the quantities supplied in the table in Problem 3-1 are unchanged.
The amount demanded, however, has increased by 30 million at each price. Construct the resulting demand curve in the illustration you made for Problem 3-1. Is this an increase or a decrease in demand?
What are the new equilibrium quantity and the new market price? Give two examples of changes in ceteris paribus conditions that might cause such a change.
Problem 3-1
Suppose that in a recent market period, the following relationship existed between the price of tablet devices and the quantity supplied and quantity demanded.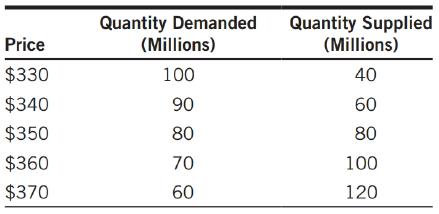
Graph the supply and demand curves for tablet devices using the information in the table. What are the equilibrium price and quantity? If the industry price is $340, is there a shortage or surplus of tablet devices? How much is the shortage or surplus?
Step by Step Answer:

This question has not been answered yet.
You can Ask your question!