

Suppose that initially the data in Problem 24-17 apply, but then an increase in fixed costs occurs.
Question:
Suppose that initially the data in Problem 24-17 apply, but then an increase in fixed costs occurs. As a result, the ATC curve in Figure 24-6 shifts upward. Consequently, the average total cost of producing 9.5 units of output rises to $5 per unit. Does the monopolist's profit-maximizing weekly output rise, fall, or remain the same? What is the new amount of maximized weekly economic profits?
Problem 24-17
Take a look at Figure 24-6. Suppose that Q1, is 9.5 units per week, that P, is $6.10 per unit, and that the average total cost of producing the 9.5 units is $4.26 per unit. What is the dollar amount of maximized monopoly profits displayed by the green area?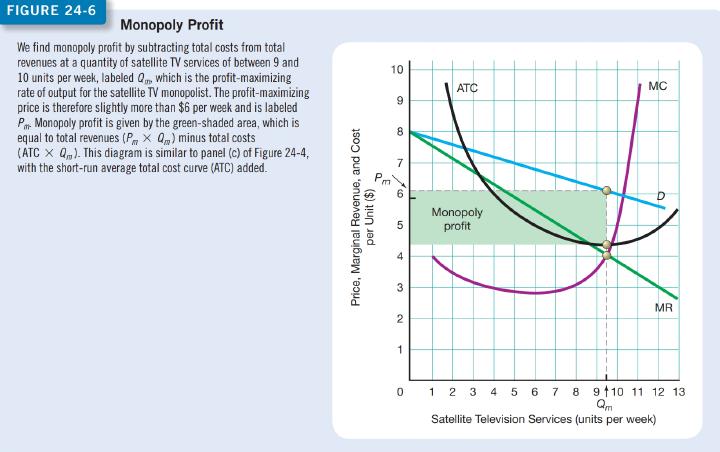
Fantastic news! We've Found the answer you've been seeking!
Step by Step Answer:

Answered By
Cristine kanyaa
I possess exceptional research and essay writing skills. I have successfully completed over 5000 projects and the responses are positively overwhelming . I have experience in handling Coursework, Session Long Papers, Manuscripts, Term papers, & Presentations among others. I have access to both physical and online library. this makes me a suitable candidate to tutor clients as I have adequate materials to carry out intensive research.
1538+ Reviews
3254+ Question Solved
Related Book For 

Question Posted:
