

Consider the following estimates from the early 2020s of shares of income to each group. Use graph
Question:
Consider the following estimates from the early 2020s of shares of income to each group. Use graph paper or a hand-drawn diagram to draw rough Lorenz curves for each country. Which has the most nearly equal distribution, based on your diagram?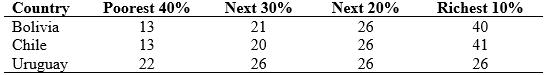
Fantastic news! We've Found the answer you've been seeking!
Step by Step Answer:
A Lorenz curve is a graphical representation of income distribution within a population To draw a Lo...View the full answer

Answered By
PALASH JHANWAR
I am a Chartered Accountant with AIR 45 in CA - IPCC. I am a Merit Holder ( B.Com ). The following is my educational details.
PLEASE ACCESS MY RESUME FROM THE FOLLOWING LINK: https://drive.google.com/file/d/1hYR1uch-ff6MRC_cDB07K6VqY9kQ3SFL/view?usp=sharing
3+ Reviews
10+ Question Solved
Related Book For 

Question Posted:
