

Consider the following table, which shows the change in inventories for each quarter from the first quarter
Question:
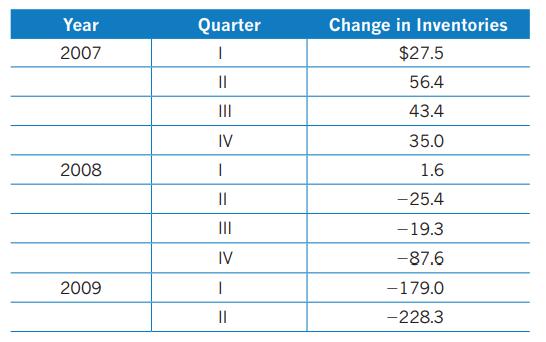
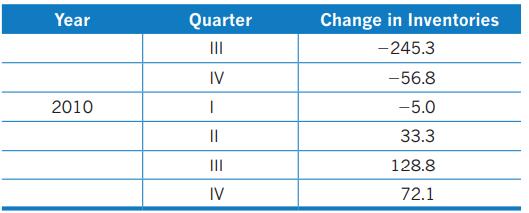
Consider the following table, which shows the change in inventories for each quarter from the first quarter of 2007 (2007:I) through the fourth quarter of 2010 (2010:IV) measured in billions of 2012 dollars. Provide a macroeconomic explanation for this pattern.
Fantastic news! We've Found the answer you've been seeking!
Step by Step Answer:
The pattern of changes in inventories over the years from the first quarter of 2007 2007I through the fourth quarter of 2010 2010IV can be explained f...View the full answer

Answered By
Bhartendu Goyal
Professional, Experienced, and Expert tutor who will provide speedy and to-the-point solutions. I have been teaching students for 5 years now in different subjects and it's truly been one of the most rewarding experiences of my life. I have also done one-to-one tutoring with 100+ students and help them achieve great subject knowledge. I have expertise in computer subjects like C++, C, Java, and Python programming and other computer Science related fields. Many of my student's parents message me that your lessons improved their children's grades and this is the best only thing you want as a tea...
2+ Reviews
10+ Question Solved
Related Book For 

Question Posted:
