Graph the demand data in Problem 3. Can you identify any trends, cycles, or seasonal patterns? Data
Question:
Graph the demand data in Problem 3. Can you identify any trends, cycles, or seasonal patterns?
Data From Problem 3:
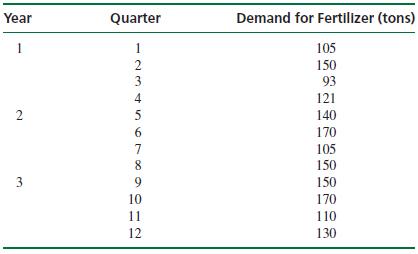
The Fastgro Fertilizer Company distributes fertilizer to various lawn and garden shops. The company must base its quarterly production schedule on a forecast of how many tons of fertilizer will be demanded from it. The company has gathered the following data for the past 3 years from its sales records:
a. Compute a three-quarter moving average forecast for quarters 4 through 13 and compute the forecast error for each quarter.
b. Compute a five-quarter moving average forecast for quarters 6 through 13 and compute the forecast error for each quarter.
c. Compute a weighted three-quarter moving average forecast, using weights of .50, .33, and .17 for the most recent, next most recent, and most distant data, respectively, and compute the forecast error for each quarter.
d. Compare the forecasts developed in (a), (b), and (c), using cumulative error. Which forecast appears to be most accurate? Do any of them exhibit any bias?
Step by Step Answer:
a Threequarter moving average forecast for quarters 4 through 13 Quarter Demand 3Quarter Moving Aver...View the full answer