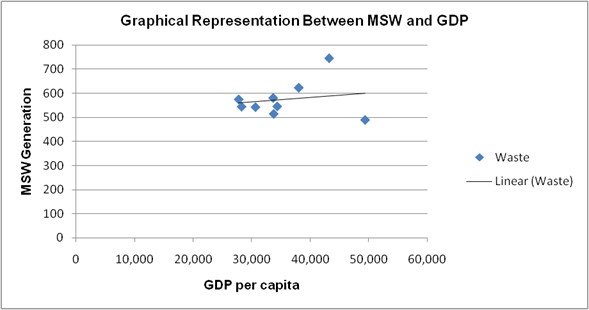
Using the data in Table 1.2, graphically illustrate the relationship between a countrys per capita GDP and
Question:
Graph
Transcribed Image Text:
Graphical Representation Between MSW and GDP 800 700 600 500 400 Waste 300 - Linear (Waste) 200 100 10,000 20,000 30,000 40,000 50,000 60,000 GDP per capita MSW Generation
Fantastic news! We've Found the answer you've been seeking!
Step by Step Answer:
Answer rating: 90% (11 reviews)
As discussed in the text and as indicated by the slope of the trend line in the above graphi...View the full answer
Answered By
PALASH JHANWAR
I am a Chartered Accountant with AIR 45 in CA - IPCC. I am a Merit Holder ( B.Com ). The following is my educational details.
PLEASE ACCESS MY RESUME FROM THE FOLLOWING LINK: https://drive.google.com/file/d/1hYR1uch-ff6MRC_cDB07K6VqY9kQ3SFL/view?usp=sharing
3.80+
3+ Reviews
10+ Question Solved
Related Book For
Environmental Economics and Management Theory, Policy and Applications
ISBN: 978-1111826673
6th edition
Authors: Scott J. Callan, Janet M. Thomas
Question Posted:
Students also viewed these Business questions
-
Using the data in Table 11.1, a. Compute the annual returns for a portfolio with 25% invested in North Air, 25% invested in West Air, and 50% invested in Tex Oil. b. What is the lowest annual return...
-
Using the data in Table 21.1, compare the price on July 24, 2009, of the following options on JetBlue stock to the price predicted by the Black-Scholes formula. Assume that the standard deviation of...
-
Analyzing budget data for the United States government The annual budget of the United States is very complex, but this case requires that you analyze only a small portion of the historical tables...
-
Write the acceleration vector a at the point indicated as a sum of tangential and normal components. r(0) = (cos, sin 20), 0 =
-
Suppose that you are the vice president of operations of a manufacturing firm that sells an industrial lubricant in a competitive market. Further suppose that your economist gives you the following...
-
Condensed balance sheet and income statement data for Fellenz Corporation are presented below. InstructionsCompute the following values and ratios for 2011 and 2012.(a) Earnings per share.(b) Working...
-
Which of the following is an extensive property? (a) Free energy (c) Specific heat (b) Refractive index (d) Surface tension.
-
Incomplete financial statements for Tanner Company are given below: The following additional information is available about the company: a. Selected financial ratios computed from the statements...
-
ACCOUNTS AMOUNTS IN PESO June July 1 Cash on hand 20,000.00 45,000.00 2 Accounts Receivable 10,000.00 15,000.00 3 Sales 230,000.00 220,000.00 4 Allowance for doubtful accounts 5,000.00 5,000.00 5...
-
An inspector for a military agency desires a variables sampling plan for use with an AQL of 1.5%, assuming that lots are of size 7,000. If the standard deviation of the lot or process is unknown,...
-
Faced with the oil crisis of the mid-1970s, the U.S. Congress instituted Corporate Average Fuel Economy (CAFE) standards. These have been increased over time, most recently in 2010 for the 2012-2016...
-
Use your basic knowledge of economic principles to discuss how the market premise operates under the "polluter-pays principle."
-
A cannon-ball of 5 kg acts as a piston in a cylinder of 0.15 m diameter. As the gun-powder is burned a pressure of 7 MPa is created in the gas behind the ball. What is the acceleration of the ball if...
-
What is the value of the following expression? 100+61 +(-3)+(-1)
-
Solve the system graphically 2x + y = -4 x + 3y = 3
-
Suppose that a bond costs $850 to buy today, but will pay $1075 over the next 12 months. If the current monthly interest rate is i-2.33%, what is the Present Value of the bond's benefits? Hint: use...
-
Open-economy AE model with proportional taxes : Consider an AE model with trade in which AE=C +Ip +G + (EX-IM). Consider planned aggregate expenditure model with taxes proportional to income: so that...
-
Absolute and Comparative Advantage Use the table below to answer the questions concerning absolute and comparative advantages. Lumber Automobiles United States 8 8 Canada 4 2 1. Which country has an...
-
A wave travels to the right on a string with constant tension and a mass density that slowly increases from on the far left to on the far right. The mass density changes slowly enough that its...
-
This problem continues the Draper Consulting, Inc., situation from Problem 12-45 of Chapter 12. In October, Draper has the following transactions related to its common shares: Oct 1 Draper...
-
Why is money not considered to be a capital resource in economics? Why is entrepreneurial ability considered a category of economic resource, distinct from labor? What are the major functions of the...
-
Below is a production possibilities table for consumer goods (automobiles) and capital goods (forklifts): a. Show these data graphically. Upon what specific assumptions is this production...
-
Specify and explain the typical shapes of marginal-benefit and marginal-cost curves. How are these curves used to determine the optimal allocation of resources to a particular product? If current...
-
Assume that you are the leadership team of a convenience store chain that has more than 300 outlets. The company is facing an inventory shrinkage problem, and store managers report that the main...
-
1 . An employee at Amy's candles has noticed that some order quantities in the two reports presented are different although the order numbers are the same. We normally refer to such data as dirty....
-
On Monday, April 5, 2010, just before 3:00 in the afternoon, miners at Massey Energy Corporation's Upper Big Branch coal mine in southern West Virginia were in the process of a routine shift change....
Study smarter with the SolutionInn App