

A scientist is modelling the number of people, N, who have fallen sick with a virus after
Question:
A scientist is modelling the number of people, N, who have fallen sick with a virus after t days.
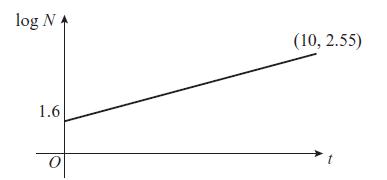
From looking at this graph, the scientist suggests that the number of sick people can be modelled by the equation N = abt, where a and b are constants to be found.
The graph passes through the points (0, 1.6) and (10, 2.55).
a. Write down the equation of the line.
b. Using your answer to part a or otherwise, find the values of a and b, giving them to 2 significant figures.
c. Interpret the meaning of the constant a in this model.
d. Use your model to predict the number of sick people after 30 days. Give one reason why this might be an overestimate.
Fantastic news! We've Found the answer you've been seeking!
Step by Step Answer:
To find the equation of the line we need to use the given points 0 16 and 10 255 to find the v...View the full answer

Answered By
Abdul Wahab Qaiser
Before working at Mariakani, I volunteered at a local community center, where I tutored students from diverse backgrounds. I helped them improve their academic performance and develop self-esteem and confidence. I used creative teaching methods, such as role-playing and group discussions, to make the learning experience more engaging and enjoyable.
In addition, I have conducted workshops and training sessions for educators and mental health professionals on various topics related to counseling and psychology. I have presented research papers at conferences and published articles in academic journals.
Overall, I am passionate about sharing my knowledge and helping others achieve their goals. I believe that tutoring is an excellent way to make a positive impact on people's lives, and I am committed to providing high-quality, personalized instruction to my students.
0 Reviews
10+ Question Solved
Related Book For 

Edexcel AS And A Level Mathematics Pure Mathematics Year 1/AS
ISBN: 9781292183398
1st Edition
Authors: Greg Attwood
Question Posted:
